Predicting the outcome of nasal high flow therapy using the Respiratory-Rate-Oxygenation (ROX) index
 | Author*: |
Predicting the outcome of nasal high flow therapy using the Respiratory-Rate-Oxygenation (ROX) index
| Author*: |
In the last decade, nasal high flow (NHF) has become a first-line therapy for patients
with acute hypoxemic respiratory failure.1 NHF is a powerful oxygenation tool.2
However, a high FiO2 can potentially mask deterioration and delay escalation of care.
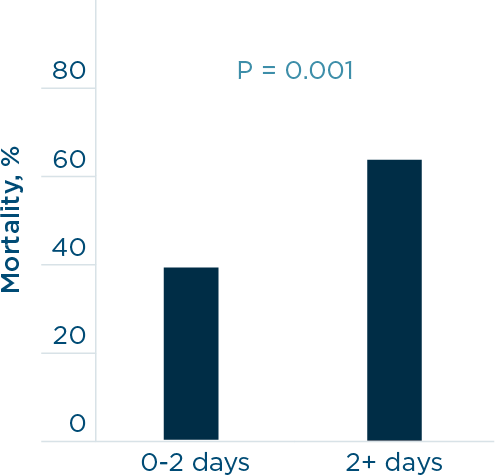
1. Patients who were intubated after more than 2 days on NHF had a higher mortality rate.5
The risk of invasive mechanical ventilation is well understood, although delaying intubation can result in a lengthened hospital stay and increased mortality.3,4 In a retrospective study by Kang et al., patients receiving NHF therapy who were intubated earlier had lower mortality, improved extubation success, and fewer days on a ventilator.5
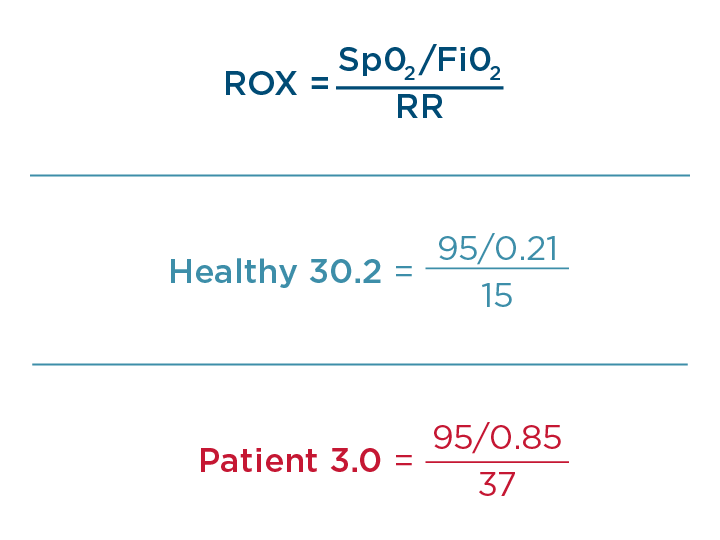
Roca and colleagues (2016) first established the ROX index to predict the success of NHF therapy.6 The ROX index combines three common measurements: FiO2, SpO2, and respiratory rate. NHF of 50 L/min and higher in adults exceeds inspiratory flow and reduces the entrainment of air. This makes delivered FiO₂ more precise and it can be used for the ROX calculation. The index is based on two well-known facts: sicker patients require more oxygen and have a higher respiratory rate.7
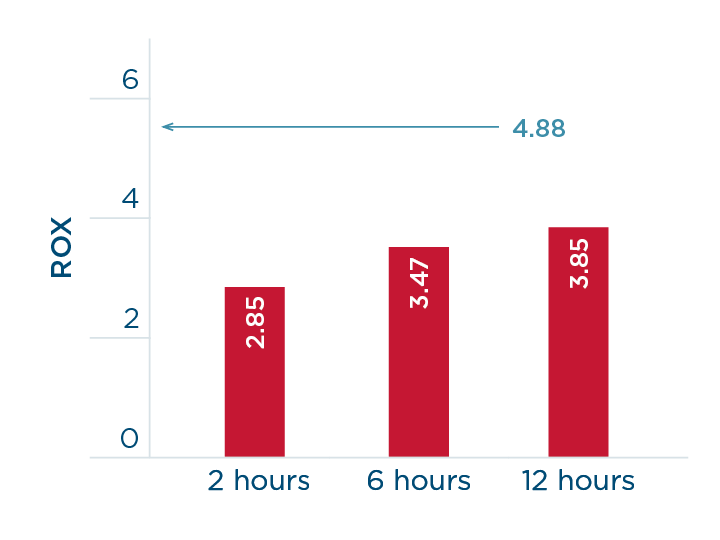
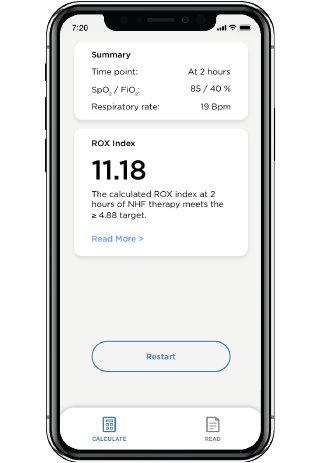
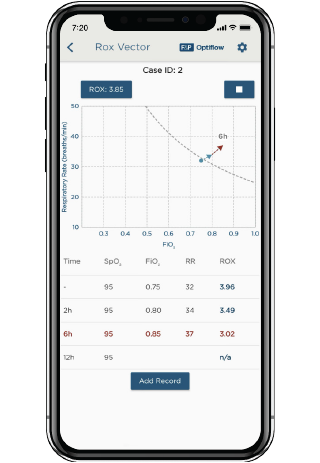
2. The ROX that predicts failure shown in red at 2, 6 and 12 hours and the ROX that predicts success above 4.88.
The index has been validated in a multi-center prospective study on 191 patients with pneumonia.8 The authors confirmed that a ROX value of ≥ 4.88 predicted the success of NHF. In addition, ROX values were provided that predict NHF failure with a high specificity (98–99%): ≤ 2.85 at 2 hours, ≤ 3.47 at 6 hours, and ≤ 3.85 at 12 hours of NHF use.
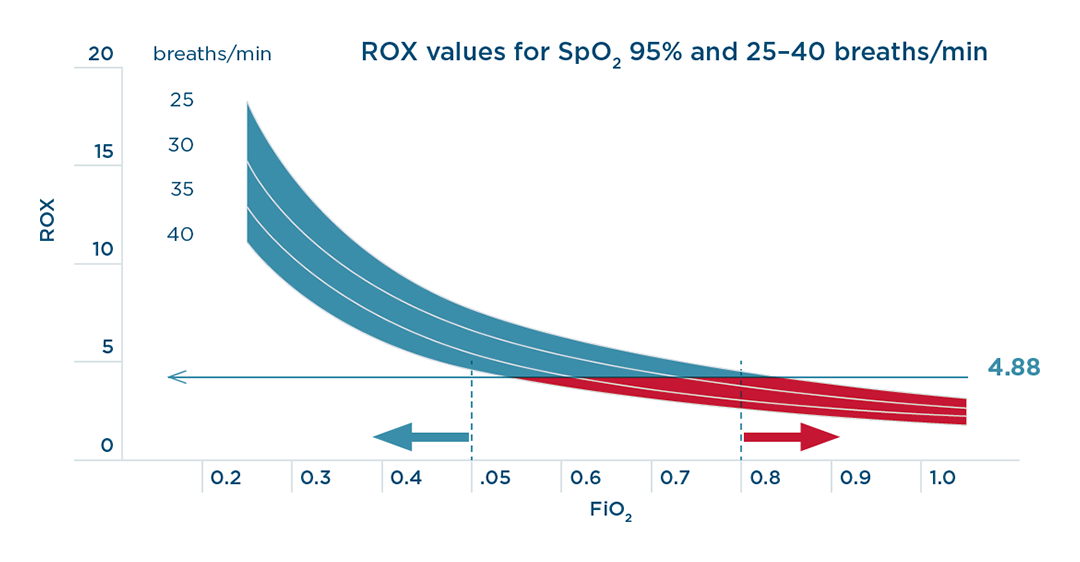
Among components of the index, SpO2/FiO2 had a greater weight than the respiratory rate.8 This is reflected in Figure 3 7: an FiO2 of 0.80 or above will predict a ROX index of less than 4.88, shown in red, and an FiO2 of 0.50 or below will predict a higher ROX, shown in blue.
If the respiratory rate and/or FiO2 requirement is increasing, then the patient is clearly deteriorating. The continuous monitoring of ROX may be particularly helpful when the patient is in an unstable condition.8
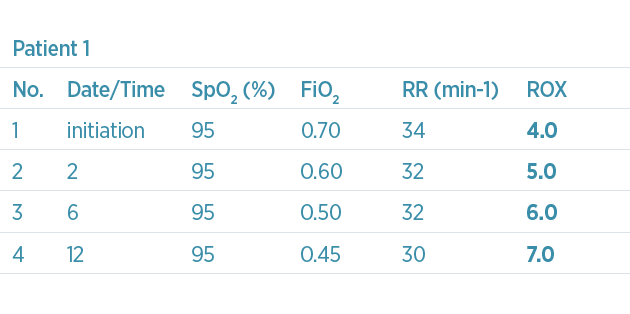
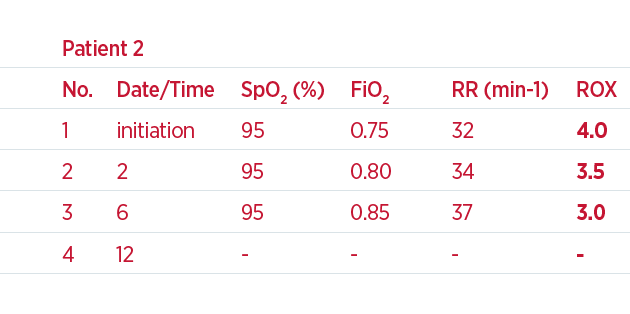
For example, two patients begin NHF treatment and both have a ROX value of 4.0 – see table below and Figure 4. Because this is only the start of the therapy, the ROX value can be monitored to see whether the index improves. During the first 6 hours, the first patient has a decrease in respiratory rate and the FiO2 has been lowered; patient 2 has an increase in respiratory rate and the FiO2 has been increased. As a result, the ROX value at 6 hours for patient 1 is 6.0 and for patient 2 is 3.0. Based on the values provided by Roca et al.,8 patient 1 has a high likelihood of NHF therapy success and can be maintained on NHF. However, patient 2 has a trending decline and low ROX; therefore, escalation of care should be considered.
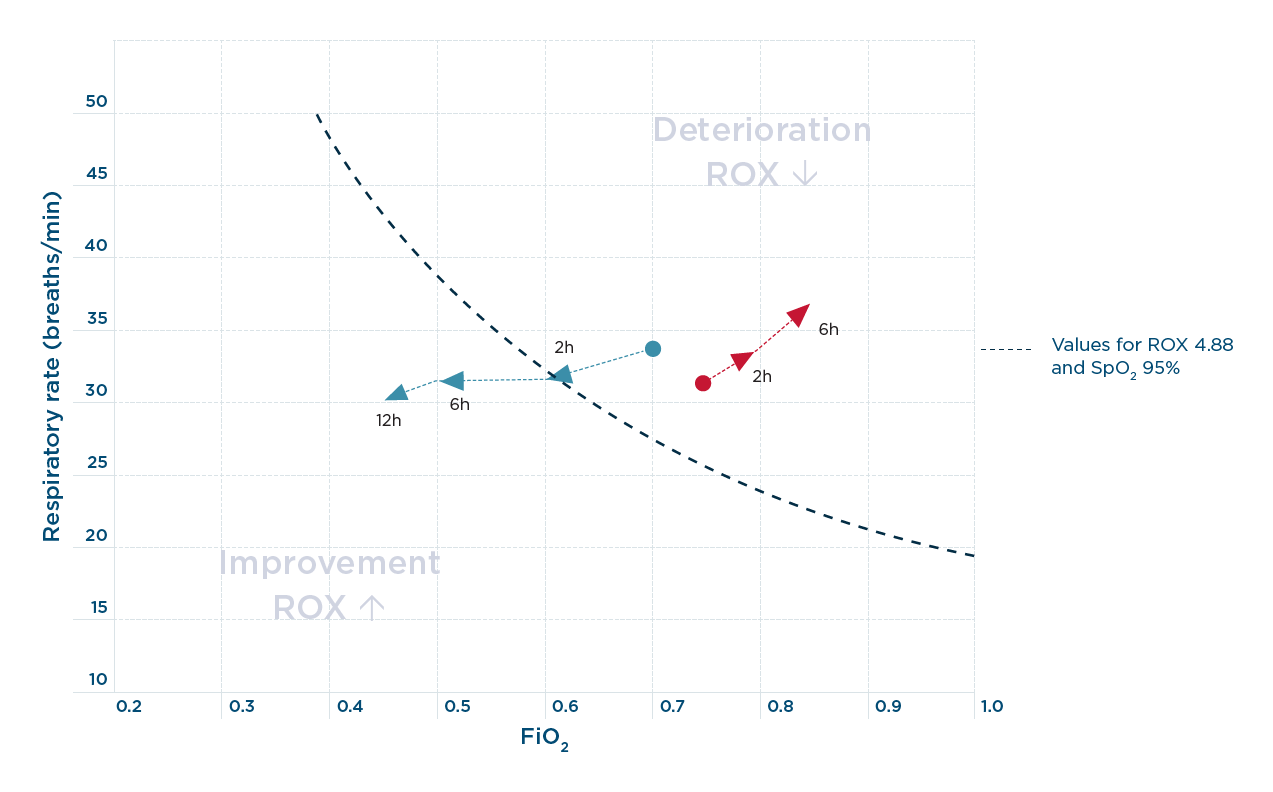
4. XY plot between respiratory rate and FiO2. The blue arrows in a vector form demonstrate a change towards NHF success and the red arrows demonstrate the change towards NHF failure. The dotted line shows the values for ROX at 4.88 and the SpO2 of 95%.
Combining the ROX values with the change in the respiratory rate and FiO2 can indicate whether escalation is required. A proposed XY plot of the key components of ROX may show the direction of changes in vector form – see arrows in Figure 4 above.9 Vectors towards the upper right indicates a deterioration and towards the lower left, an improvement.
The ROX index is a useful tool because it requires only a few data points and can be measured at the patient’s bedside. The index can be used to monitor the patient and predict the likelihood of success or failure of NHF therapy. Furthermore, ROX highlights the importance of the required FiO2; if the required FiO2 is high, then the patient may be at greater risk of failure.
|
|
|
|